Looker Studio Reporting | Visualize Your Performance

.avif)
.avif)
.avif)
.avif)
Marketing management no longer relies on intuition or scattered Excel exports.
Today, every channel generates data: Google Ads, SEO, social media, CRM. Yet, in many companies, this information remains fragmented and difficult to leverage.
Without structured reporting, it's impossible to effectively allocate budgets and optimize performance.
Looker Studio thus emerges as a central lever for transforming data into a decision-making tool.
Looker Studio: A Google Tool for Tracking
What is Looker Studio?
Formerly Google Data Studio, Looker Studio is a free data visualization tool developed by Google. It allows you to connect various sources (Google Ads, Analytics, Search Console, CRM…) to create dynamic dashboards.
It's an interactive report builder. It functions like a smart whiteboard: you choose the metrics, charts, filters, and dimensions to display. Unlike a simple spreadsheet, the data is updated automatically. The report becomes a real-time tracking tool.
What is Looker Studio really for?
Looker Studio isn't just for consolidating data. It enables you to structure a comprehensive view of performance. In many companies, metrics are analyzed channel by channel.
SEO on one side, Google Ads on the other, conversions in another tool. This fragmentation makes strategic analysis difficult. Looker Studio allows for the centralization of a significant amount of data through its multiple sources.
This centralization enables you to identify correlations between channels, compare levers, and allocate budgets.
How to create an effective Looker Studio report?
Connect the right data sources
An effective report isn't just about displaying charts. It needs to follow a business logic. Looker Studio offers native and third-party connectors.
The most commonly used in digital marketing are:
· Google Ads
· Google Analytics 4
· Google Search Console
· Google Sheets
· CRM
· SEMrush
Connecting Search Console allows you to display, for example:
· Top keywords by clicks
· Click-through rate (CTR)
· Impressions
· Top SEO pages
This data is essential for analyzing organic search performance.
Selecting truly strategic KPIs
A Looker Studio report should not display metrics out of habit. Every KPI should answer a strategic question: Is this channel profitable? Does SEO generate business opportunities? Is the cost of acquisition sustainable? Are strategic pages truly progressing?
For SEO, displaying top keywords or top pages only makes sense if this data is tied to specific goals. : lead generation, visibility for commercial search terms, progress on priority topics.
A good dashboard informs decision-making.

What types of reports can be created?
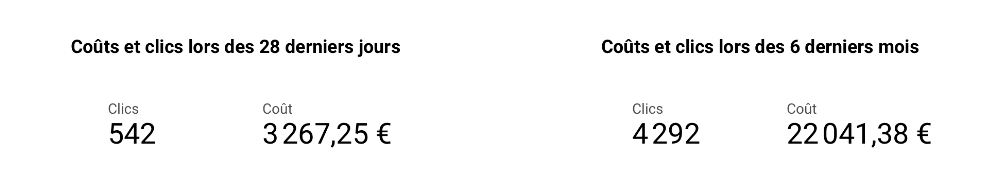
Google Ads Reporting
Looker Studio adapts to various uses. An Ads dashboard can include:
· Conversion trends
· Cost per click tracking
· Campaign performance
· Budget allocation
This type of report quickly identifies profitable campaigns and those that need optimization.
SEO Reporting: Top Keywords and Top Pages
By connecting Google Search Console, you can view :
· Keyword rankings by click count
· Pages generating the most traffic
· Fast-growing queries
· Ranking opportunities
This reporting is particularly useful for managing a content strategy.
Why use Looker Studio to drive your marketing performance?
Looker Studio goes beyond just displaying charts. It allows you to structure performance analysis and align teams around common metrics.
In an environment where data comes from multiple channels (SEO, Google Ads, CRM, social), the challenge is no longer about accessing information, but about organizing it.
Structuring clear and centralized management
An effective marketing dashboard allows you to:
· Quickly visualize the most profitable channels
· Identify underperforming campaigns
· To monitor conversion trends
· To align management, marketing, and operations on the same KPIs
What's more, automatic data updates avoid manual exports and ensure real-time insights. Reporting thus becomes a continuous management tool, not just a monthly document.
Understanding limitations to avoid misinterpretations
Looker Studio remains a visualization tool. Its reliability directly depends on:
· The quality of tracking
· The conversion setup
· Data Source Consistency
Poor event tracking or a misconfigured conversion skew the analysis. Looker Studio doesn't fix a strategy. It highlights its strengths and weaknesses.
Why trust an agency with your Looker Studio reporting?
Turning Data into Decisions
Creating a Looker Studio dashboard is simple. Creating a decision-making tool is another matter. Effective reporting isn't just about displaying KPIs. It needs to answer specific questions:
· Which channels generate the most margin?
· Where is the budget misallocated?
· Which SEO pages deserve priority optimization?
· Which keywords actually drive conversions?
That's where expertise comes in.
Performance-oriented support
A well-structured Looker Studio report helps structure your marketing management and align your actions with your business objectives. But without a clear methodology, it quickly becomes just a visualization tool.
At Afalence, we design performance-oriented reports, crafted to transform data into an optimization lever. Do you want to structure a truly actionable dashboard to manage your campaigns and SEO?
Contact us to set up strategic reporting tailored to your specific needs.

See also our other articles
Let's discuss your needs
Are you looking for a web agency for your project? Contact us and find out how we can help you.